Diagrams have always been a wonderful medium to understand and manage complicated tasks. And when it comes to the flowchart, there are numerous things it has to offer. From clearly presenting the perfect picture of any process to inspecting to establishing the standards for quality and efficient working, it helps in the smooth functioning of all the processes. Not only this, further it helps in communicating the whole process with the team. And assists in locating unrequired steps and bottlenecks that help in upgrading the work. Isn’t it so much helpful? Yes, it is! So, let’s dive deeper into flowcharts and see how to create one.
What is a flowchart?
A flowchart refers to a diagram that portrays any process or algorithm, from top to bottom or right to left, in steps. It illustrates the whole work in small tasks and comes to an end with a solution or end of the process. It can be drawn on paper as well as digitally with the help of any software. It’s like a virtual map for your journey through a process that makes the path easy to understand. Many authors have categorized the flowcharts by making their own bases. For instance, Sterneckert has classified the charts based on “Flow Control”. According to him, flowcharts are of 4 types. They are:
Document Flowcharts, System Flowcharts, Data Flowcharts, and Program Flowcharts.
Likewise, there are many types in the flowcharts on other bases.
So, how does it help to understand things easily?
A flowchart helps in understanding difficult processes in one go by simplifying the workflow or algorithm. It provides a perfect picture of any complex process. And help in tracking what has been done, what to do next, and what is pending. One can easily analyze the situation and follow it for ensured and desired results. And ultimately, it provides a pre-defined conclusion at the end of a particular scenario. It displays the whole process in different shapes for different types of steps. Since the steps in a chart can be some action, decision making, documentation, input/output, wait or delay, etc. So, there is a corresponding shape for all types of steps. These are not the hard & fast rules, but some global standards to make these accessible by everyone. For instance, if a step involves some decision making, you need to use a rhombus shape. And this is how you have various shapes for various types of steps. And the arrows work as a path to show the order of steps. There are many appealing shapes for the steps, such as rectangle, rhombus, oval, etc.
Prominent shapes and their use in the flowchart
The different shapes were created eventually to define the types of steps. And there are numerous shapes for different flowcharts and their steps. Some prominent and frequently used shapes are as follows:
Terminator – It is in an oval shape for starting & ending points. It is also used for the result/outcome of some path in the chart. Decision – It gives two boxes that result from “Yes” and “No” answers to the decision. In computer algorithms, it can be understood by “if-else” statements used to compare and produce binary outputs. Process – A rectangular-shaped symbol is used frequently for some definite action or function in the process. There may be single steps in these boxes, or you can include more than one continuous step together. Document – This shape is inserted while getting any document for input. For instance, receiving letters, emails, orders, etc. When some document is available for the output of data or order, this symbol is in use. Examples of documents available for output are creating a memo, letters, etc. Data (Input/Output) – The rhomboid shape in the diagram denotes some data available for input or output in the process. Pre-defined Process – It represents some familiar process or a process that is defined somewhere else. Additionally, it can be used for some complex processes. It’s not necessary to include these in the flowchart, but one can use them to understand any process’s internal functioning. Manual Input – As the name suggests, it refers to the input of data physically by someone. Normally, the input of data is done through some gadget or tool. Delay – This symbol is for the delayed work in some part of the process. You can also mention the delayed time-period within the D box for a clear depiction. Comment or Annotation – The comment symbol is in use when any step requires some additional information. This symbol is in braces with the required text. It can also have a dashed line connected with a specific section of the flowchart that requires explanation. Database – It is in a cylindrical shape used when some data is stored in a storage service. On-page Connector – An On-page connector is a small circle that links different elements on the same page to avoid confusing and cluttered meshes. Off-page Connector – It helps in linking the different elements on separate pages. For some complex processes, you sometimes may need to create long enough flowcharts to cover several pages. In that case, these off-page connectors make things easy.
Popular Flowchart Use-Cases
Besides computer algorithms, they are widely used in other fields such as business, manufacturing, education, engineering, sales, and marketing. They encompass every possible area of a process in these fields. And give a full backup from beginning to end. So, before creating one for yourself, let’s look at some popular use-cases of flowcharts.
Efficient computer algorithms
Flowcharts are proved to be the most helpful in developing efficient computer algorithms. Since they help understand the complicated issues, they can feature the whole idea to create an effective logical solution as algorithms. So, it helps in communicating, discussing, analyzing the algorithms as well.
Planning new projects
Many people in a team generally work on new projects frequently. So, flowcharts prove to be very helpful while planning them. Most probably, they help in effectively portraying the steps needed to complete the whole project.
Auditing the Processes
In addition to giving a clear picture of the work, flowcharts are efficient enough to spot the process’s issues. When the whole work is split into small steps connected sequentially, it helps identify unnecessary things and allows making improvements. This saves time and ensures a smooth workflow.
Managing Workflow
Workflow diagrams (a type of flowchart) are in use for managing workflow. Managing the workflow may target either the direction of human work or integration of processes, or both. The processes are set in the best way that results in the most effective and efficient output at the end.
Modeling Business Processes
Flowcharts are beneficial for documenting business processes. These processes can be very typical, with many possibilities or results in the end. So, flowcharts can make things certain and give a proper direction for them. Notably, a unique type of diagram is in use that is an “event-driven process chain” (EPC) diagram for business processes.
Decision making 🤔
Flowcharts can show all the possible choices to make the decision-making process fast, data-driven, and easy. Actually, flowcharts give direction to your decision making thoughts. Ultimately helping you to make decisions faster. Now, let’s look at some smart flow chart makers.
Miro Flowchart
Miro is excellent for making flowcharts. You can design flowcharts and distribute them to team members, get their input, edit them, add them to presentations, or integrate them directly into Confluence, Microsoft Teams, etc. In addition, you can add action items and create them into tickets from the same place with the help of Jira and Asana. Its extensive feature set and user-friendly design make it the perfect platform for practically all industries and sectors. Over 35 million people from organizations like Dell, Deloitte, Okta, Cisco, etc., utilize Miro. Even those unfamiliar with producing flow charts will find it ideal because of its adaptable architecture and wide range of features. The platform’s intuitive interface enables real-time collaboration in various contexts, including meetings and workshops, agile workflows, strategy and planning, sticky notes, flow charts, diagrams, etc. Users can make mind maps, wireframes, and other forms of diagrams and collaborate on them. Its drag-and-drop interface makes adding and connecting parts simple. Its extensive template library makes it easier and faster to design flow charts with a professional appearance. Global security standards like SOC2, SOC3, CSA, and many others are considered when building Miro. Every facet of how teams connect, come up with ideas and store their work is safe and secure. With few features, Miro is free to use. To use its full-fledged platform, you must upgrade to one of its three premium versions—starter, business, or enterprise.
Creately
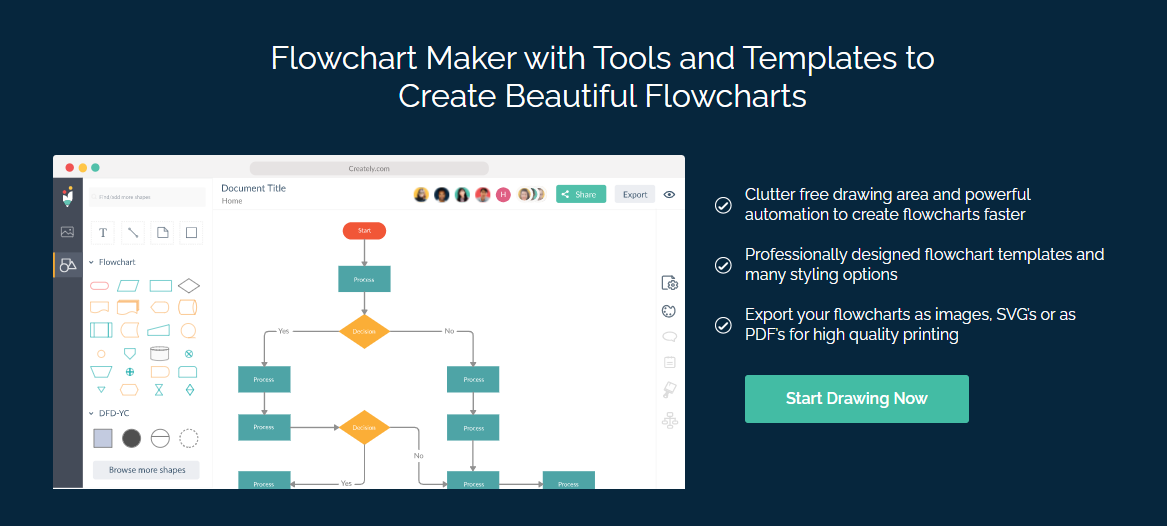
A very handy tool to create flowcharts with the help of templates, Creately, comes with automation that’ll make the process a lot faster. It has tons of different shapes, diagram types, toolbar shortcuts, themes, and styles that help your content shine. You can get started with the free plan, which comes with limited features. The paid plans starting from $4.95/month gives you the edge with more allowance so that you can get a real taste of the tool’s capabilities. If you are an AWS cloud architect, then you like their diagramming tool.
Edraw
Compatible with Windows, Mac, and Linux systems, Edraw Flowchart Maker is as good as the other ones mentioned in this article. In fact, it’s trusted by some of the biggest brands in the world, such as Samsung, IBM, and Intel. It comes with various symbols, shapes, and elements that can be incorporated using their drag and drop interface. It’s also super easy to use. If you’re somebody who has never used a tool like this before, you won’t have difficulty figuring things out. See the software in action here: The best thing about Edraw Flowchart Maker has got to be their lifetime access pricing, which saves you tons of money down the road.
Lucidchart
Lucidchart is a drag and drop flowchart builder that comes with a huge library of shapes and elements. You can start with a blank canvas or choose a template to make things real quick. All of the added shapes can be connected in proper sequence and customized in colors, text, etc. Once you’re done creating, you can save and share your flowchart in various formats and also collaborate with your team members at any point in time. Moreover, Lucidchart lets you integrate with Google Workspace and Microsoft Office apps to increase productivity and achieve more while doing the same work.
Zen Flowchart
Absolutely free and trusted by over 650,000+ users worldwide, including Google and Spotify, Zen Flowchart completely dominates this list mostly because of their ease of use. All it takes is a few clicks to assemble your flowchart. Start by adding new nodes or link different nodes together with the help of smart connectors. The interface is super clean and minimal, allowing you to focus solely on creating your content without any distractions. Moreover, you can easily change the nodes’ color and further style it with just one click. Once you’re done creating your flowchart, you can save it as PNG or as a live document that adapts to your latest changes.
SmartDraw
You can either use SmartDraw online or download the software on your Windows system to create your flowchart. Both of these options are a matter of your preference because no matter what you choose, the ease of use will be the same. You can start by picking one of the many pre-made templates and then add steps on that in just a few clicks. You don’t have to worry about formatting, as that’s done automatically by the tool. You just have to add simple commands, and it’ll do all the rearranging of the elements to make it look great. All of your created flowcharts can be stored in a shared folder, allowing your team to come together for productive collaboration whenever needed. If you get stuck somewhere or have any doubts, you can email or call up their brilliant support team for help.
Diagrams
As the name suggests, Diagrams allow you to make a flowchart and various diagrams meant for different purposes. It has way too many elements to add to your project, and it’s all divided into different categories, like basic, advanced, miscellaneous, etc. Within the canvas, you can do many customizations to make sure you’re creating something pure of your taste and not limited by the software. It also takes one click to make all your arrows and elements to connect for proper alignment. You may also want to check out this software to create an application architecture diagram.
Canva
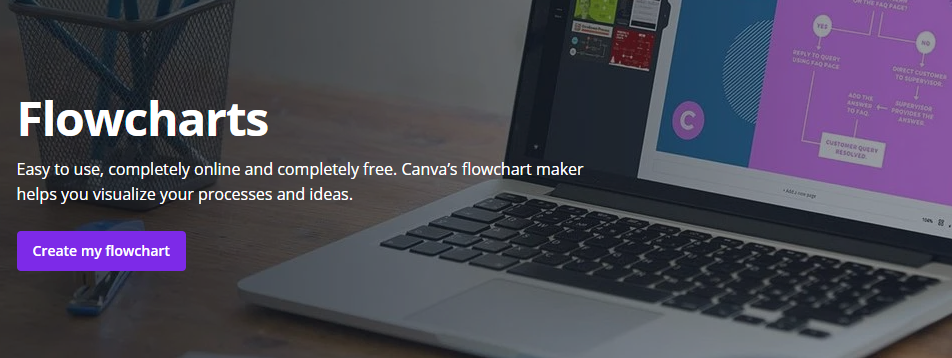
We’ve all heard about Canva and how great it is, so there was no way I was going to leave it out of this list. Apart from the many possibilities of this tool, you can create amazing-looking flowcharts with professionally-designed templates and adjust the colors, fonts, and alignment easily. It’s made with the non-designer in mind, which is why everything is drag and drop. You can utilize up to 20 different graphs and add various symbols, images, icons, etc. Once you’re done creating the flowchart, you can save it, download it, or even embed it into your presentations with just a few clicks.
Conclusion
So we have discussed flowcharts and their uses. And how you can start creating impressive flowcharts. Next, you can also explore the Mind Map Maker to visualize your ideas.


